In the Xcode, you have three separate areas of working – Navigators (in red), Debug area(in green) and Utilities(in
blue).
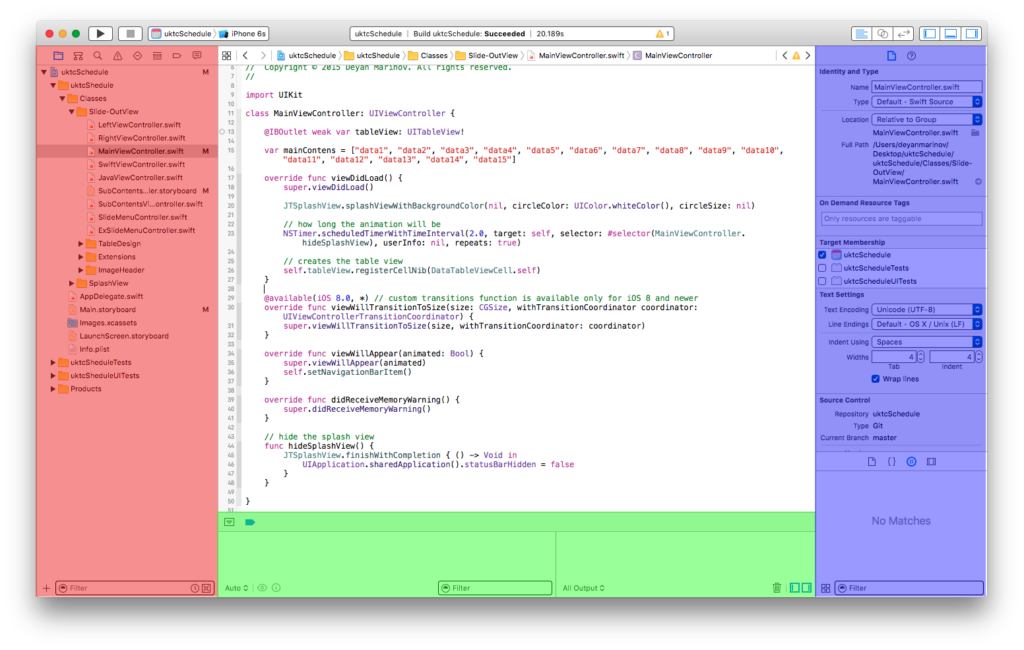
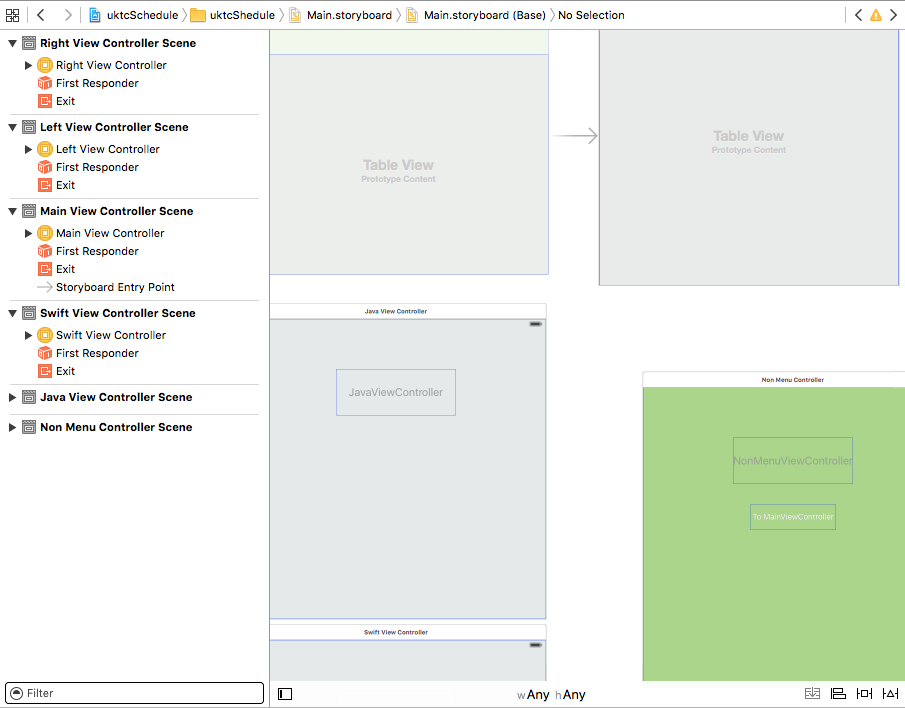
The workspace window always includes the editor area. When you select a file in your project, its contents appear in
the editor area, where Xcode opens the file in an appropriate editor. For example, in the image above, the editor
area MainViewController.swift, a swift code file that is selected in the Navigator area on the left of the workspace.
The navigator window contains the following eight options:
- Project navigator. Add, delete, group, and otherwise manage files in your project, or choose a file to view or edit its contents in the editor area.
- Symbol navigator. Browse the symbols in your project as a list or hierarchy. Buttons on the left of the filter bar let you limit the shown symbols to a combination of only classes and protocols, only symbols in yourproject, or only containers.
- Find navigator. Use search options and filters to quickly find any string within your project.
- Issue navigator. View issues such as diagnostics, warnings, and errors found when opening, analyzing, and building your project.
- Test navigator. Create, manage, run, and review unit tests.
- Debug navigator. Examine the running threads and associated stack information at a specified point or time during program execution.
- Breakpoint navigator. Fine-tune breakpoints by specifying characteristics such as triggering conditions.
- Report navigator. View the history of your build, run, debug, continuous integration, and source control
- tasks.
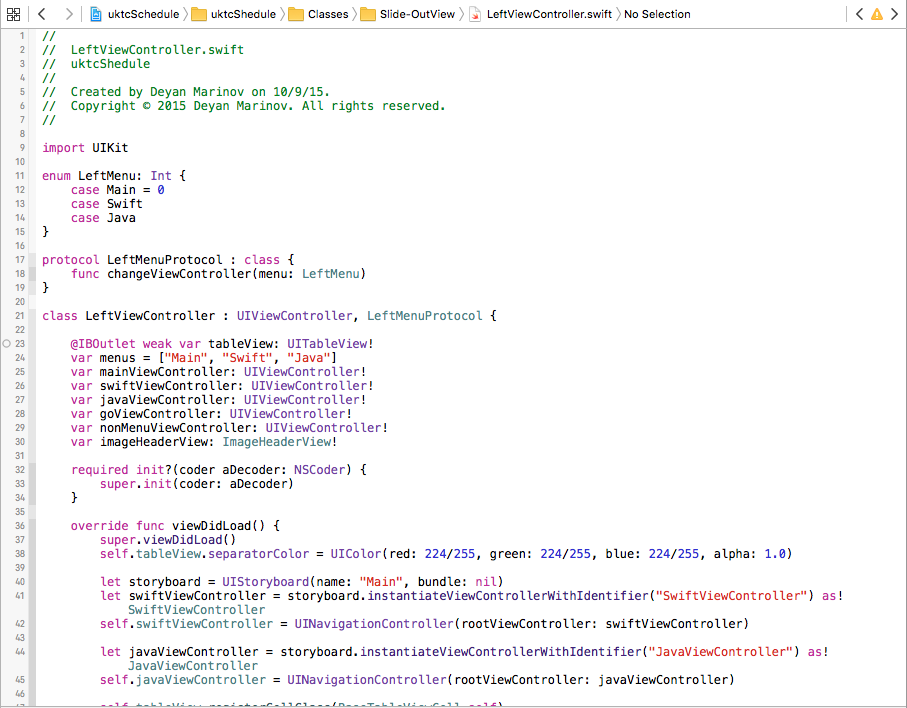
The Editors
Most development work in Xcode occurs in the editor area, the main area that is always visible within the
workspace window. The editors you use most often are:
- Source editor. Write and edit source code.
- Interface Builder. Graphically create and edit user interface files.
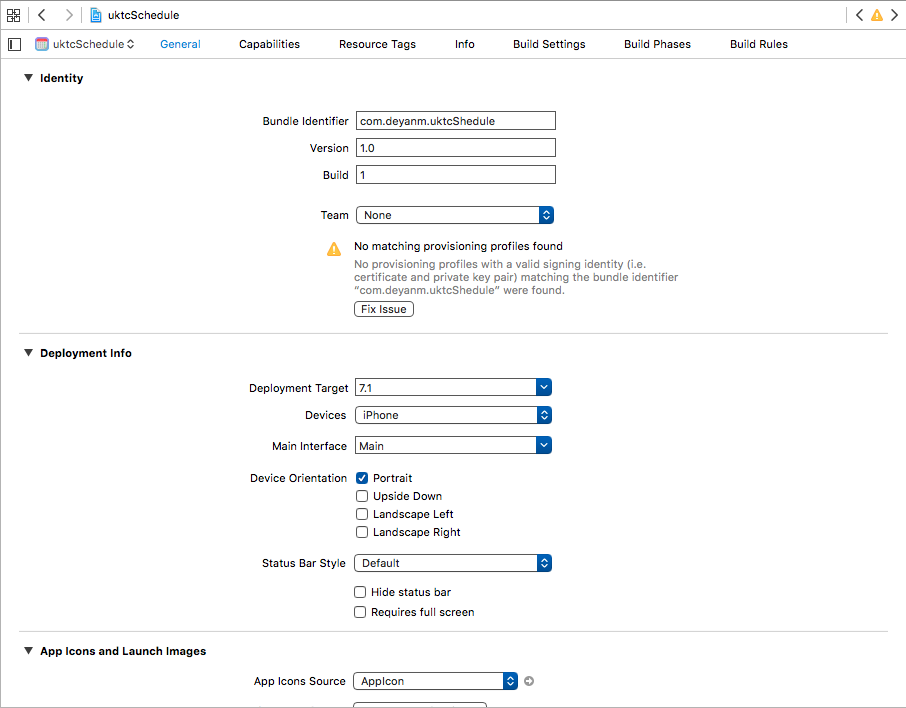
- Project editor. View and edit how your apps should be built, such as by specifying build options, target architectures, and app entitlements.
Configure the editor area for a given task with the editor configuration buttons on the right side of the toolbar:

- Standard Editor. Fills the editor area with the contents of the selected file.
- Assistant Editor. Presents a separate editor pane with content logically related to content in the standard editor pane. You can also change the content.
- Version Editor. Shows the differences between the selected file in one pane and another version of that same file in a second pane. This editor works only when your project is under source control.
Resources and Elements in Utilities Area
The utilities area on the far right of the workspace window gives you quick access to these resources: Inspectors, for
viewing and modifying characteristics of the file open in an editor Libraries of ready-made resources for use in your
project
The top panel of the utilities area displays inspectors. The bottom pane gives you access to libraries.
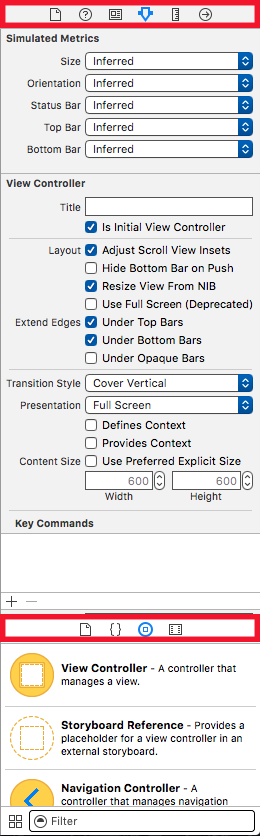
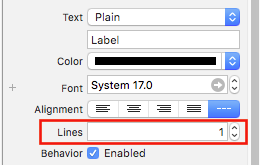
The first panel (highlighted in red) is the Inspector bar, use it to choose the inspector best suited to your current
task. Two inspectors are always visible in the inspector bar (additional inspectors are available in some editors):
- File inspector. View and manage metadata for the selected file. Typically you will localize storyboards and other media files and change settings for user interface files.
- Quick Help. View details about a symbol, an interface element, or a build setting in the file. For example, Quick Help displays a concise description of a method, where and how the method is declared, its scope, the parameters it takes, and its platform and architecture availability.
- File templates. Templates for common types of files and code constructs.
- Code snippets. Short pieces of source code for use in your software, such as class declarations, control flows, block declarations, and templates for commonly used Apple technologies.
- Objects. Items for your app’s user interface.
- Media. Files containing graphics, icons, sound files, and the like.
To use a library, drag it directly to the appropriate area. For example, to use a code snippet, drag it from
the library to the source editor; to create a source file from a file template, drag its template to the project
navigator.
To restrict the items displayed in a selected library, type relevant text into the text field in the Filter bar (the bottom
pane). For example, type “button” in the text field to show all the buttons in the Objects library.
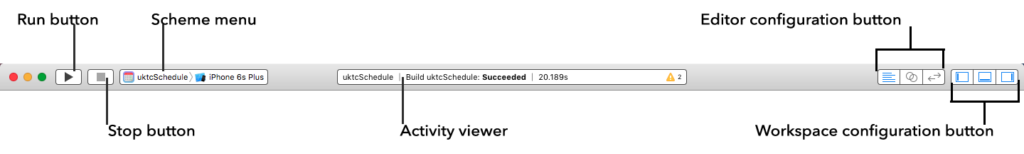
Manage Tasks with the Workspace Toolbar
The toolbar at the top of the workspace window provides quick access to frequently used commands. The Run
button builds and runs your products. The Stop button terminates your running code. The Scheme menu lets you
configure the products you want to build and run. The activity viewer shows the progress of tasks currently
executing by displaying status messages, build progress, and other information about your project.
The editor configuration buttons (the first group of three buttons) let you configure the editor area, and the
workspace configuration buttons (the second group of three buttons) hide or show the optional navigator,
debug, and utilities areas.
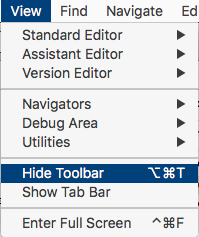
The View menu includes commands to hide or show the toolbar.